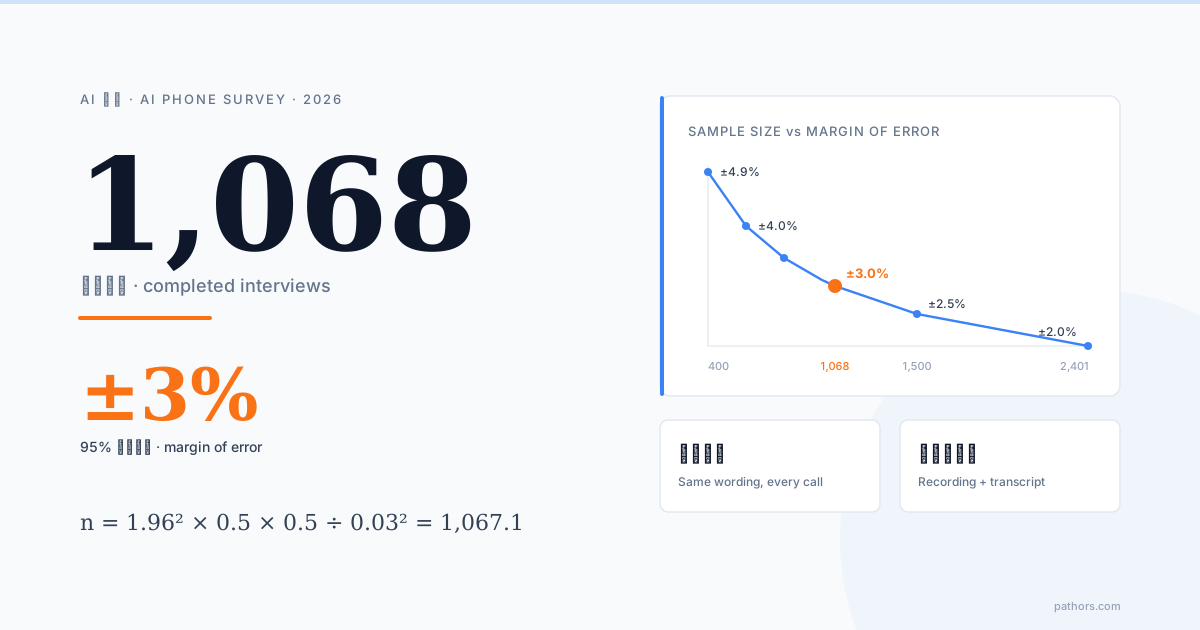
"1,068 completed interviews, ±3% margin of error at the 95% confidence level." The line shows up on customer satisfaction studies, market research and other telephone survey reports, yet few readers really understand it. When the interviewer changes from a person to an AI, these concepts do not change; they matter more. AI phone surveys change where error comes from and what shape it takes, not the rules of statistics.
This is a tutorial. We walk through seven concepts you need before running an AI phone survey or designing a telephone questionnaire, each with a worked business-survey example, so you can judge how far a phone survey's numbers can be trusted.
Concept 1: Confidence level and margin of error, and where 1,068 comes from
To estimate a proportion (say, the share of satisfied customers) under simple random sampling, the required sample size is:
n = z² × p(1−p) ÷ e²
Worked example: 95% confidence, p = 0.5, e = 0.03 gives n = 1.96² × 0.25 ÷ 0.0009 = 1,067.1, rounded up to 1,068.
"95% confidence" means that if you repeated the sampling many times with the same method, about 95% of the intervals would contain the true value. It does not mean the true value has a 95% probability of lying in this particular interval. Keeping ±3% at 99% confidence needs about 1,844 completes.
Also, ±3% is the maximum, at p = 0.5. If a result is 10%, the same 1,068 completes give about ±1.8%.
Concept 2: The sample-size table and subgroup error
| Sample size | Max margin of error (95% confidence) |
|---|---|
| 100 | ±9.8% |
| 200 | ±6.9% |
| 300 | ±5.7% |
| 500 | ±4.4% |
| 1,068 | ±3.0% |
| 1,500 | ±2.5% |
| 2,401 | ±2.0% |
Two takeaways: error shrinks with the square root of the sample, so halving it takes four times the sample; and ±3% belongs to the full sample only.
Worked example: in a 1,068-complete customer satisfaction survey, only 200 respondents became customers in the past year. Their subgroup error is about ±6.9%. If the report says "new customers 52% satisfied vs 48% overall", that 4-point gap sits inside the subgroup error; you cannot conclude new customers are happier.
Concept 3: Response rates, and why you dial many more numbers
1,068 is the number of completes, not dials. Common funnel measures are the contact rate (working numbers where a respondent was reached), the cooperation rate (contacted eligible respondents who completed) and the response rate (completes relative to all eligible cases). AAPOR's Standard Definitions are the widely used reference.
Worked example (illustrative; rates are assumptions, not industry data):
| Stage | Assumed rate | Numbers |
|---|---|---|
| Numbers dialled | — | 12,715 |
| Working numbers | 70% | ~8,900 |
| Eligible respondent reached | 40% | ~3,560 |
| Interview completed | 30% | ~1,068 |
Under these assumptions you dial about 12 numbers per complete, before callbacks. A low response rate does not by itself make results wrong, but it raises the next question: are the people who did not answer like the people who did?
Concept 4: Sampling error vs non-sampling error
Sampling error is random error from interviewing only part of the population; a formula captures it and it shrinks as the sample grows. Non-sampling error is systematic and does not go away with a bigger sample:
| Type | In plain words | Example |
|---|---|---|
| Coverage error | Some people are not in the frame | Dialling landlines only misses mobile-only customers |
| Nonresponse error | Responders differ from refusers | Busy working customers complete less often |
| Measurement error | Answers do not reflect true views | Interviewer tone, wording, mishearing, recording mistakes |
| Processing error | Mistakes in handling data | Manual entry and coding errors |
The ±3% on a report covers only the first kind of error, sampling error. When two surveys on the same topic differ by 8 points, the reason is usually in this table.
Concept 5: Interviewer effects, and what changes when the interviewer is an AI
When different interviewers administer the same questionnaire, answers vary systematically by interviewer. This interviewer effect can be measured with an intra-interviewer correlation ρ, and it inflates variance:
Design effect ≈ 1 + ρ × (average completes per interviewer − 1)
Worked example: 20 interviewers share 1,068 completes (about 53 each). Assume ρ = 0.01 (illustrative). The design effect is about 1 + 0.01 × 52 = 1.52, the effective sample drops to about 701, and the margin of error widens from ±3.0% to about ±3.7%, while the report still says ±3%.
With an AI interviewer, every call uses the same wording, tone and pace, read verbatim, so the between-interviewer component disappears. That is a statistical property, not a marketing claim: consistent wording means consistent measurement conditions.
The flip side: every call shares one "interviewer". If the script leads, the bias does not average out; it applies identically to every call. AI turns interviewer variance into a question of whether the script is neutral, which makes piloting and question review more important. Speech-recognition errors and mode effects (people answering a machine differently) are measurement error too, and need validation.
Concept 6: Nonresponse bias and weighting: what weighting fixes and what it can't
Nonresponse bias is roughly the nonresponse rate × the difference between responders and non-responders.
Worked example: response rate 30%; 60% of responders are satisfied, but only 50% of non-responders are. The true value is 0.3 × 60% + 0.7 × 50% = 53%, yet the report says 60%: a 7-point bias, far larger than ±3%.
Weighting is the usual correction: align the sample's structure with the population. Worked example: customers aged 60+ are 40% of the customer base but 30% of the sample, so their weight is 40 ÷ 30 ≈ 1.33; everyone else gets 60 ÷ 70 ≈ 0.86.
Weighting can fix imbalances on the weighting variables (age, sex, region). It cannot fix differences between willing and unwilling respondents within the same group, or people the frame never covered. It also has a cost: the more uneven the weights, the smaller the effective sample. The weights above reduce 1,068 completes to an effective ~1,019; more variables and more extreme weights inflate error further.
Concept 7: Question wording and order effects in voice surveys
People behave differently when they hear a questionnaire instead of reading it:
These effects exist with human and AI interviewers alike, but AI repeats your design word for word: a good design is good on every call, a biased one is biased on every call.
Compliance note (Taiwan)
Put the seven concepts together: ±3% describes sampling error only. Whether a phone survey can be trusted depends on coverage, nonresponse and measurement error, and on what weighting costs. An AI interviewer has one clear statistical advantage on measurement: it applies the same script verbatim on every call, removing differences between interviewers, and it keeps a recording and transcript of each call so what was asked and answered can be audited. Sampling, weighting and questionnaire design remain the researcher's job.
Further reading:
Frequently Asked Questions
Why do phone surveys so often use 1,068 completed interviews?
At 95% confidence, a conservative expected proportion of 0.5 and a ±3% margin of error, n = 1.96² × 0.5 × 0.5 ÷ 0.03² = 1,067.1, which rounds up to 1,068.
What does a 95% confidence level mean?
If you repeated the sampling many times with the same method, about 95% of the confidence intervals would contain the true value. It does not mean this particular interval has a 95% chance of containing it.
Does a ±3% margin of error mean the result is accurate to within 3 points?
No. ±3% covers sampling error only, and only for the full sample. Coverage error, nonresponse bias, interviewer effects and question wording are not included, and subgroups have larger error.
Are AI phone surveys more accurate than human interviewers?
AI does not change sampling error, but reading the same script verbatim on every call removes differences between interviewers. The trade-off: a biased script biases every call, and speech recognition and mode effects need validation. Compare against your existing method.
Can weighting correct every bias?
No. Weighting only corrects imbalances on the weighting variables such as age, sex and region. It cannot fix differences between responders and refusers within a group, and it reduces the effective sample size.
How many completes does a customer satisfaction phone survey need?
It depends on the precision you need and how many subgroups you will compare. At 95% confidence, ±5% needs about 385 completes and ±3% about 1,068. If you compare branches or customer segments, each subgroup also needs enough completes of its own.